Why Universities Invest in LMS: 8 Ways for Growth & Efficiency

Money’s tight, everyone’s doing extra work, and students want help on their phones late at night…
If you want to grow, it pays to keep students enrolled, get new programs going sooner, and make money from short courses that add up. As for getting things done, it saves time each semester, it lowers support costs, and it cuts the number of IT requests.
A good learning management system makes it simple, which means courses get made quicker, and students stay progressing actively.
For administrators, deans, program heads, course designers, and IT folks: LMS is what supports your school. It gives you content and tests, enables people to do things they want to do together, and shows you loads of useful information, integrates perfectly into your student information system and login systems.
Here are eight things you can start doing today: simplify course creation and publication, learning data helps you make smarter decisions, set up alerts in the early stage, automate grading, provide rooms for teachers to work together, ensure you’re checked off, provide micro-credentials and lifelong learning, and reconnect everything to reduce total expense.
By the time we’re done, you’ll have a plan to get started and a simple way to measure your ROI that you can tailor to your own school.
TLDR
Before we go deep, here’s the short version:
- Streamline delivering your course and scale: Reuse templates, modules, and section copy to launch more sections with less prep work and fewer support tickets.
- Analytics that improve outcomes: Cohort dashboards, engagement heatmaps, and outcomes mapping to show where learners stall, what to fix next and which courses deserve investment.
- Conferencing and assessment automation to get faster feedback: Auto-grading, banks, clear rubrics, plagiarism checks, and secure proctoring reduce turnaround time and help to maintain grading consistency.
- Automation of assessment and faster feedback: Reduce the time required for the assessment and contribute to the increase in grading consistency.
- Faculty productivity and collaboration: Reduce coordination overhead through co-teaching, TA roles, group work, and peer review.
- Compliance and accreditation readiness: Outcomes alignment, audit trails, WCAG/ADA support, and reporting bundles make it easy to gather evidence for reviews and avoid last-minute scrambles.
- Micro-credentials and New Revenue: Short courses, certificates, CEUs, e-commerce, and employer partnerships allow you to test demand and open fresh program lines for your institution.
- Integrations that lower TCO: Single sign-on, SIS sync, LTI tooling, content libraries, and analytics exports cut down on manual work and keep your data clean.
What Is an LMS for Higher Education?
An LMS is the cornerstone for teaching and learning. It organizes classes, connects people with content, and keeps track of participation and outcomes. It works with your SIS, ID, library, and data tools to handle day-to-day learning tasks.
For example, a section of Biology 101 launches every term. The instructor replicates a vetted course template, adds lectures, and configures weekly quizzes. Students enroll via the SIS and are automatically rostered into the site. Quizzes are auto-scored, rubrics accelerate providing feedback on writing assignments, notifications are sent regarding students who are not participating, and grades are pulled back into the SIS.
Common Pitfalls & How to Avoid Them
Most LMS projects fail for predictable reasons. The fixes are simple, but they require discipline. Use the patterns below to keep momentum steady and results visible.
Over-customization that slows everything down
It starts with small changes: more stuff on the menu for courses, custom plugins, and special ways to grade. By the middle of it, every class is different, people need more tech help, and updates seem scary.
The fundamentals of each class should be the same, but people can have leeway regarding the little details. There is one standard design for each course, one method of grading for each kind of assignment, and a small list of approved tools. Test anything else out to gather information first. Only take it mainstream when it actually enhances learning or saves resources.
Unclear governance and decision rights
If you don't know who approves templates, risk guidelines, or how things fit together, decisions get stuck. Make a one-page chart of who is Responsible, Accountable, Consulted, and Informed. Hold one weekly meeting to make decisions; keep a simple, visible calendar of changes.
Ensure that every change has someone responsible, a start date, and something to measure to see if the change worked. If there isn't consensus on whether to create a change, try it in one area for two weeks, observe the results, and make an informed decision based on the information.
Training that shows clicks but not purpose
Faculty training often stops at "where to find the button." That does not change behavior. Train the workflow, not only the interface: how a rubric cuts grading time, why item analysis sharpens banks, how an early alert prevents a withdrawal.
Keep sessions limited to 90 minutes, record them, and then hold office hours. Provide a two-page TA playbook that includes how to moderate discussion, process regrade requests, and set turnaround targets.
Data silos that block insight
Without SSO, SIS sync, and a standard analytics export, the same data gets retyped in multiple places and never matches. Connect identity first, then rosters, then grades. Limit external tools to those with LTI 1.3 and grade return.
Define the metrics in plain language inside the dashboard. Publish a short data dictionary, so teams read the same numbers the same way. Schedule a weekly digest with retention risk, time to feedback, and completion so leaders see movement without chasing reports.
Quick checks to keep risk low:
- Course shells match the master template, with only approved variations.
- Change requests logged, tested in the sandbox, and reviewed against a target metric.
- Training covers workflow benefits, not just button paths.
- SSO, SIS, and LTI in place before the term starts, with a single analytics export.
- Definitions for retention, completion, and time to feedback are visible in every report.
1. Streamline Course Delivery and Program Scale
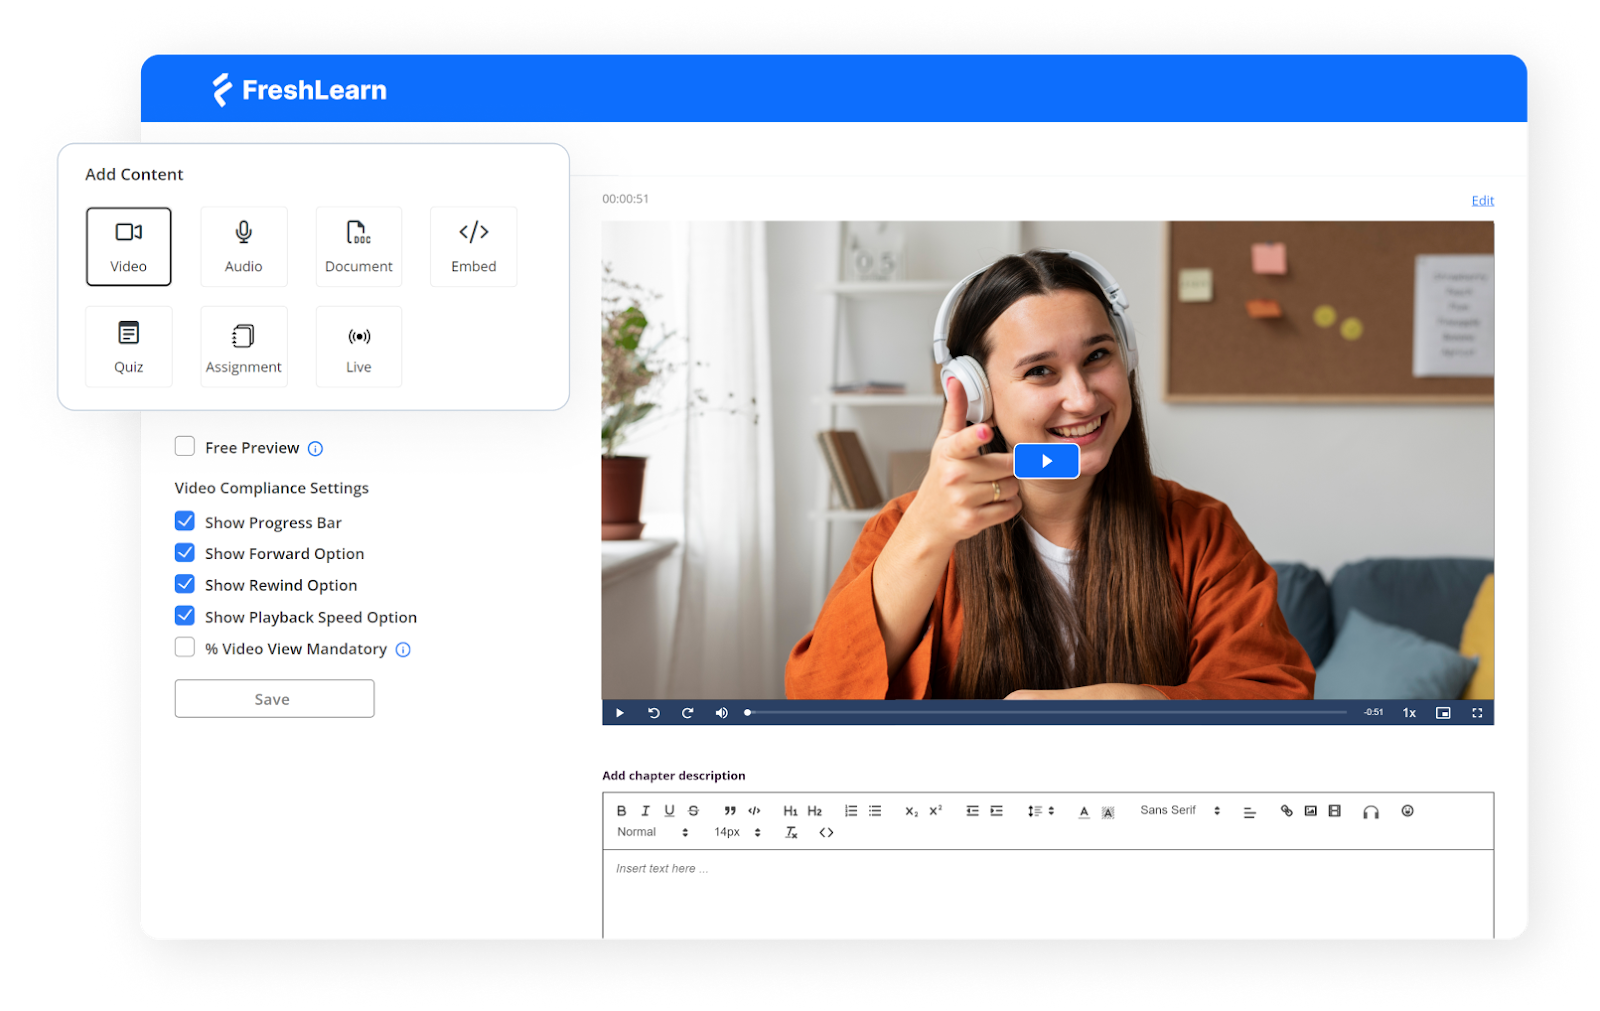
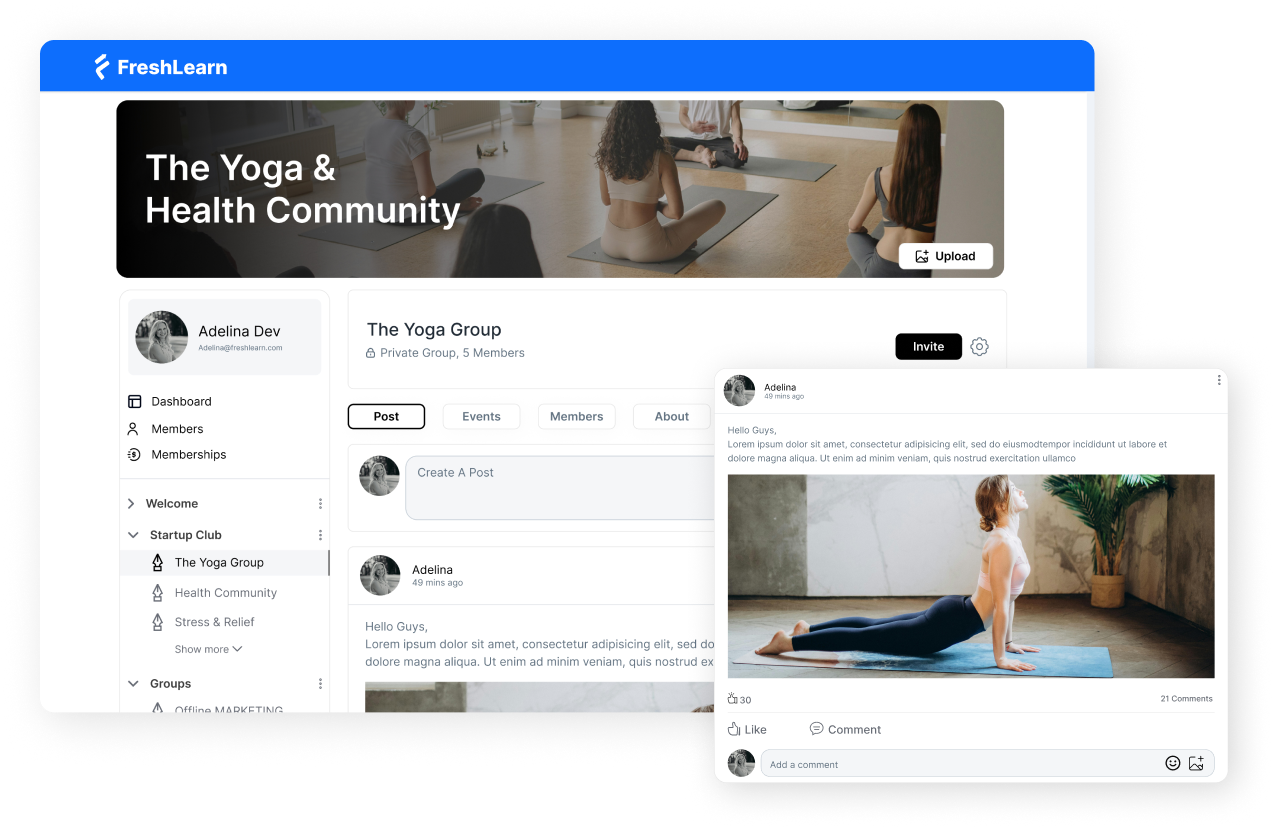
I start every course with a master template. I use the SCORM-ready LMS platform FreshLearn, which comes with built-in weekly modules, a quiz bank, clear rubrics, and a tidy gradebook. When new sections open, I copy that template, and most preparation is done before anyone asks for support.
From there, I use a small library of reusable pieces: Orientation, Academic Integrity, Writing Help, Lab Safety, and Weekly Check-in are all maintained in one location. I update the source once, and then roll the change into every active section. Students see the same structure across the program, which means fewer questions and more momentum.
Section setup becomes a short routine.
I clone the course, shift the dates with the calendar tool, assign the instructor and TAs, and post a welcome note with office hours. Because the layout remains consistent, faculty spend their time teaching and providing feedback rather than rebuilding pages.
Delivery follows a similar weekly rhythm in any format. A short lecture video, a low-stakes quiz, a discussion, and one applied task form the spine. For blended classes, I use FreshLearn to mark what happens on campus and what happens online. For a fully online program, I add a live session or a recorded option while keeping assessments identical so expectations stay clear.
Impact you can feel:
- Faster launches and fewer last-minute fixes.
- Less drift between sections and more precise student navigation.
- More time for feedback, less time spent rebuilding pages.
2. Data-Driven Learning Analytics That Improve Outcomes
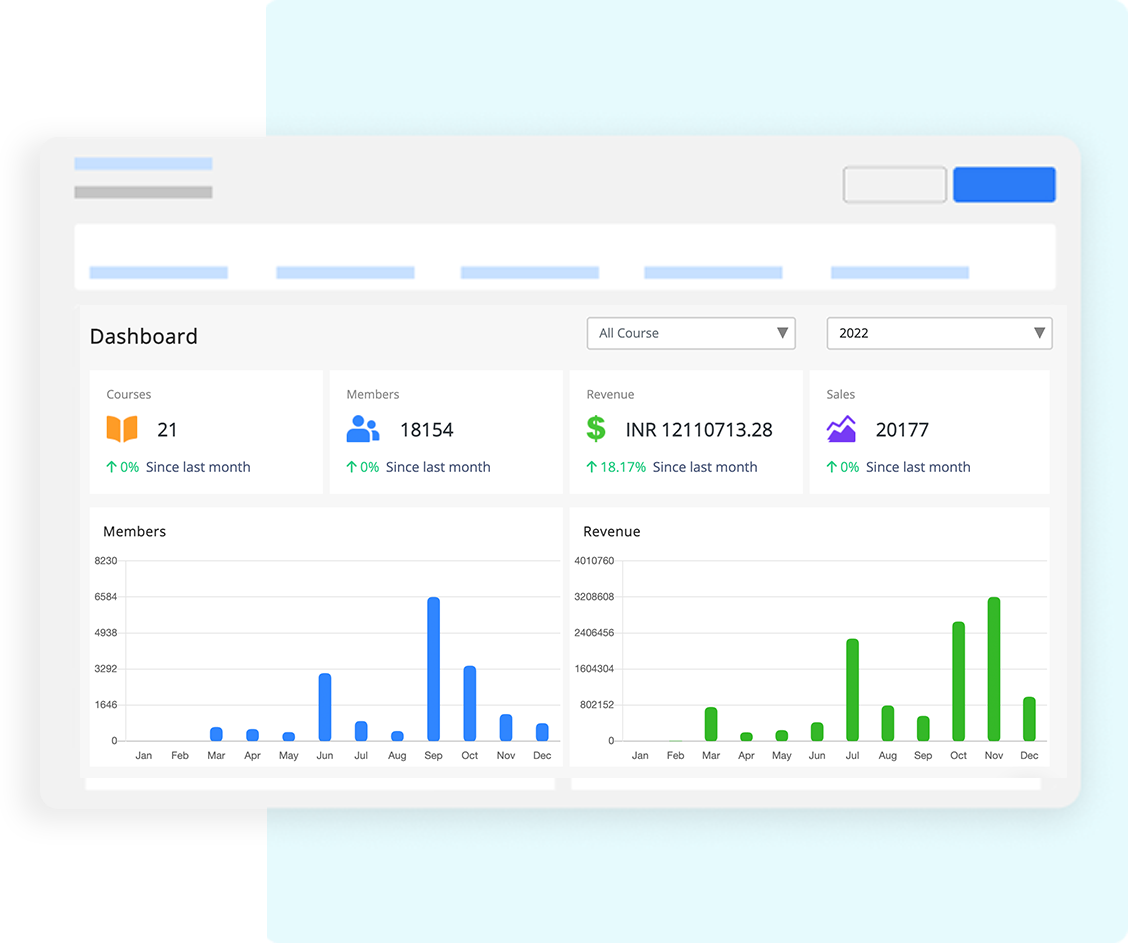
I use the analytics in FreshLearn to spot friction early, confirm what works, and guide coaching. The goal is simple: turn raw activity into clear decisions that improve learning.
I start with three levels of view:
- At the program level, I watch enrollment, completion, and grade distribution across courses.
- At the course level, I track weekly engagement, quiz item performance, and time to feedback.
- At the student level, I review participation patterns and outcome mastery. This pyramid keeps leaders, faculty, and advisors on the same page.
Engagement heatmaps help me see where momentum dips. A week with fewer logins, short session times, or missed submissions needs attention. I check the content there, shorten instructions, add a quick practice task, and post a reminder. Small changes at the right moment lift completion.
Cohort analysis shows differences between sections. If one group excels on a module while another lags, I compare announcements, deadlines, and activity design. Often, the fix is a clearer prompt or a short explainer video.
Outcomes mapping closes the loop. Each assessment ties to learning outcomes, so I can see mastery by outcome, not just by score. When an outcome lags, I adjust the task, add a scaffold, or schedule a mini-review.
Here is the table I share with faculty each term:
I keep this routine every week: scan the dashboard, pick one bottleneck, ship one improvement. Over a term, these small moves add up.
Next, I turn these insights into action with retention and early-alert workflows that route help to the right people at the right time.
3. Retention and Early-Alert Workflows
I turn analytics into action with a simple rule: catch friction early, then make the first move. The workflow rests on four parts that work together: risk scoring, humane nudges, clear routing, and tidy case notes.
Each one is small on its own. Together, they keep students from quietly slipping away.
Risk scoring
Using FreshLearn, I track a few signals and keep the math simple. Missed submissions, low quiz streak, days since last login, short time on task, and no discussion activity.
Scores fall into green, yellow, or red, so I know where to look first. I check trends, not one-offs. A student who rebounds is removed from the list. Another who slips two weeks in a row moves up. Simple bands keep focus on who needs help today.
Nudges that feel personal
Short, kind messages work best. I name the gap in one sentence, offer a next step in the second, and link to help. “You missed the Week 3 quiz. Watch this two-minute review, then use the 24-hour grace window.”
I avoid lectures and canned tone. If the student replies, I switch to their channel of choice and confirm the plan. The goal is movement within a day, not a perfect script.
Advisor routing
Some cases need more than a nudge. Red scores or repeated misses open a case for the right advisor.
They see a one-page view: last login, items at risk, current grade band, outreach history, and preferred contact. Ownership is clear and time-bound. Advisors schedule a quick call, confirm support, and set a check-in date. Faculty stay in the loop, so messages do not cross. Everyone knows who is doing what.
Case notes
Notes live in one place and follow one format. Date, channel, summary, promise made, and the next check. I keep them brief, factual, and respectful. That record helps new staff step in mid-term and prevents duplicate outreach.
It also surfaces patterns across courses, such as due dates that overlap or prompts that confuse many students. Clean notes improve care today and improve design for the next term.
4. Assessment Automation and Faster Feedback
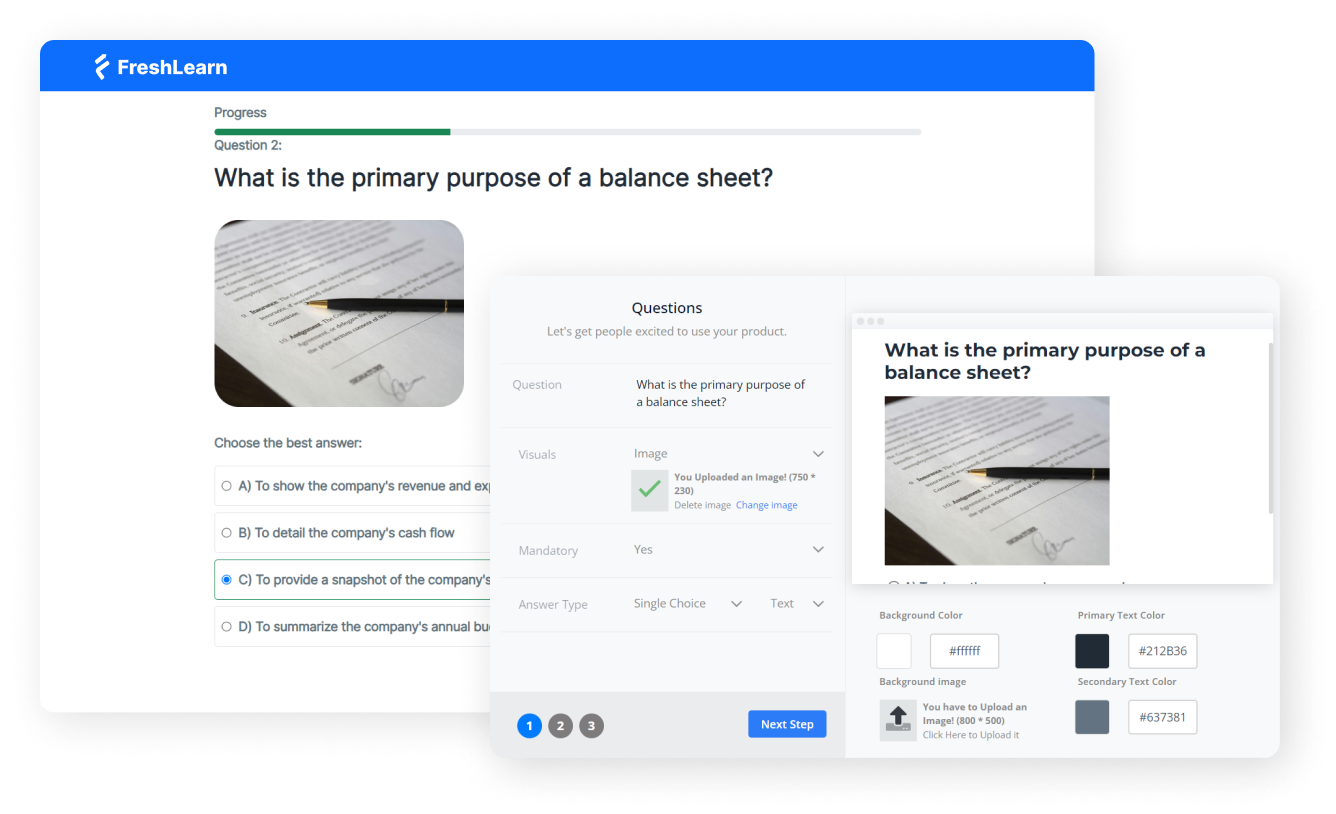
Assessment should move learning forward. The plan below keeps grading fair, fast, and clear while protecting integrity.
Recipe 1: Auto-grading for practice and check-ins
- Use when: Knowledge checks, low-stakes quizzes, weekly practice.
- Setup: Mix multiple choice, multi-select, short answer with patterns, and numeric.
- Settings: Release hints and targeted feedback on submit, allow one retry with a light penalty.
- Measure: Time to feedback, practice completion rate, second-attempt improvement.
Recipe 2: Question banks that improve each term
- Use when: You need variety and fairness across sections.
- Setup: Tag items by outcome and difficulty, randomize items and variables.
- Settings: Run item analysis after each cohort, retire vague items, promote high-discrimination ones.
- Measure: Fewer complaint tickets, tighter score distribution, outcome alignment.
Recipe 3: Rubrics that make standards visible
- Use when: Essays, projects, presentations, labs.
- Setup: Concise rows tied to outcomes, point ranges, and example comments.
- Settings: Share rubrics with students before they start, click-to-score for speed.
- Measure: Fewer grade disputes, higher revision quality, stable marking across TAs.
Recipe 4: Academic integrity with the right touch
- Use when: Written work and high-stakes exams.
- Set up: Originality reports for writing, secure browsers for select exams.
- Settings: Sensible thresholds, clear privacy notes, accessibility options, light remote proctoring only when needed.
- Measure: Cleaner submissions, targeted investigations, lower false positives.
Recipe 5: Feedback students actually use
- Use when: Pacing matters and students need quick direction.
- Setup: Batch-grade by question, small comment library for common issues.
- Settings: Add short audio or 30-second video notes when tone matters, stagger releases so guidance lands while work is fresh.
- Measure: Faster turnaround, more revisions submitted, and higher completion.
5. Faculty Productivity and Collaboration
Faculty time is precious. The LMS should cut coordination work and make feedback fast. Here are five simple patterns that scale without chaos.
- Discussions that teach, not distract: Post one focused prompt each week and pin a model reply so tone and length are obvious. Ask each student to contribute once and respond to one peer. Use reactions to surface helpful answers for quieter voices. Track reply rate and time to first response.
- Group work that runs itself: Create teams from the roster with one click, then auto-provision a shared space. Give a short checklist with roles: coordinator, writer, reviewer. Add a private group journal so tutors can see progress without chasing updates. Watch on-time submissions rise.
- Peer review that feels fair: Keep the rubric short and clear. Anonymize by default to reduce bias. Require two comments: one warm note and one specific suggestion. Open a 24-hour revision window after reviews land. You should see better drafts and fewer “why this grade?” emails.
- Co-teaching without crossed wires: Share an announcement bank, keep one gradebook view, and split ownership by weeks or modules. Leave a one-page handover note for travel or illness so the class never stalls. Monitor grading turnaround and duplicate messages to check if coverage works.
- TA roles with clear lanes: Scope permissions to the work: discussion moderation, quiz regrades, office hours, and a shared inbox. Load a comment library so feedback stays consistent across sections. Use tags to triage student questions quickly. Aim for sub-24-hour responses.
6. Compliance, Accessibility, and Accreditation Readiness

The aim is steady readiness, not last-minute scrambles. Build evidence as courses run, keep accessibility routine, and package reports that answer common accreditation questions in one place.
Map every assessment to a clear learning outcome. Keep rubrics tied to those outcomes and save a few anonymized samples per performance band each term. This creates a living portfolio that shows what was taught, how it was measured, and how students performed.
Bake accessibility into daily work. Use captions and transcripts for media, alt text for images, readable headings, keyboard navigation, and good color contrast. A short faculty checklist and a quick accessibility scan before publishing prevent most issues and support all learners.
Maintain trustworthy records. Preserve version history for rubrics and assessments, log submissions and grade changes, record accommodations, and lock settings after grading starts. Limit access by role, review audit logs, and follow a clear data retention schedule that aligns with policy.
Schedule a simple accreditation pack each term. Include outcome coverage, completion and withdrawal rates, time to feedback, grade distributions, integrity flags resolved, and early-alert outcomes. Add short notes that explain changes made and the impact observed. Review the pack in program meetings and carry improvements forward.
Short action list:
- Tag outcomes when creating assessments.
- Run an accessibility check before publishing.
- Lock rubrics once grading begins.
- Store anonymized sample work each term.
- Export a standard accreditation pack on a schedule.
- Review audit logs and retention policy quarterly.
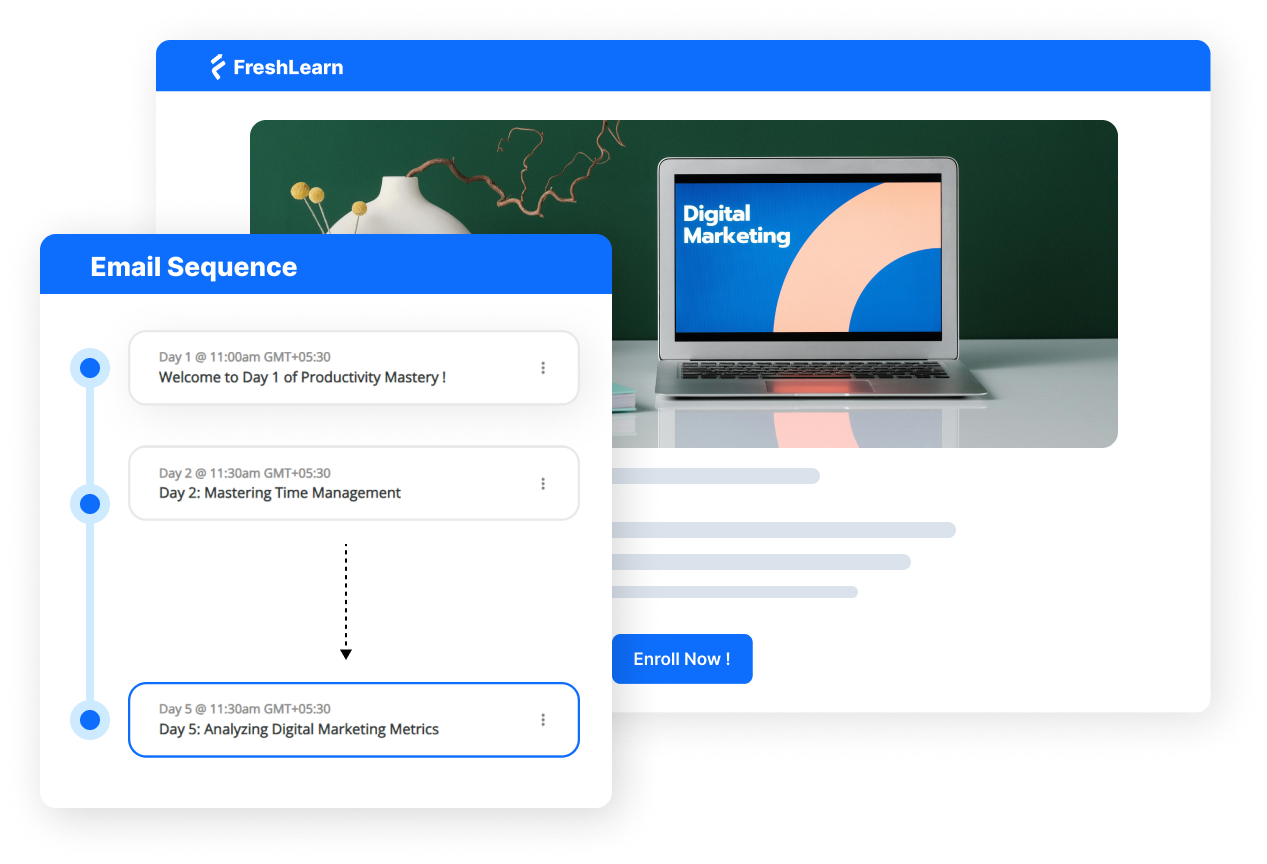
7. Micro-Credentials, Continuing Education, and New Revenue
Micro-credentials open doors to new learners and new partners. Think short, skills-focused offers that are easy to launch, stackable into certificates, and priced for adult learners. Use the LMS to handle catalog, checkout, CE tracking, and certificates so the team spends time on content and partnerships, not logistics.
Offer A: Skill Sprints (2–4 weeks)
- Setup: One clear outcome, three bite-sized modules, weekly live clinic, auto-graded checks, certificate on completion.
- Launch: Public sales page, simple price, rolling start dates.
- Measure: Enrollments, completion, time to feedback, and post-course survey.
Offer B: Certificate Bundles (8–12 weeks)
- Setup: Three to five sprints packaged as a pathway, shared rubric, CE units recorded, digital badge with metadata.
- Launch: Payment plans, employer discount code, cohort calendar, community space.
- Measure: Bundle take-rate, completion, badge verifications, repeat purchase.
Offer C: Employer-Backed Pathways
- Set up: Map outcomes to job roles, agree on success criteria, and add a capstone scored by a rubric that both teams use.
- Launch: Private checkout for the partner, roster sync, and monthly progress reports.
- Measure: Seats filled, pass rate, manager satisfaction, renewal.
8. Integrations that Cut IT Load and Total Cost of Ownership
The right integrations make the LMS feel invisible. Users sign in once, data stays in sync, tools appear where learning happens, and reports land where leaders already work. Fewer tickets. Cleaner data. Lower cost to serve.
Single sign-on (SSO, SAML or OIDC)
- One campus login for students, faculty, and staff.
- Automatic role and group mapping.
- Reduces password resets and duplicate accounts.
Student information system (SIS) sync
- Real-time or nightly roster, section, and enrollment updates.
- Drops, adds, and accommodations flow into the gradebook.
- Cuts manual CSV uploads and improves data accuracy.
LTI 1.3 tool connections
- External apps open inside the LMS with grade return.
- Keep privacy and permissions tight with scoped access.
- Standardize on approved tools to reduce shadow IT.
TCO scorecard to watch
- Tickets per 1,000 users per term.
- Time to provision a course shell.
- Percent of sections created via templates.
- Duplicate account rate after SSO go-live.
- Hours saved on roster changes and grade sync.
How to Calculate LMS ROI
Here is a simple way to calculate return on investment for an LMS.
Inputs: Licensing, services, training, admin time
- Annual platform licensing: Includes core LMS, add-ons, storage, and support.
- Implementation and services: Setup, integrations, and content migration.
- Training and change management: Faculty hours, workshops, materials.
- Ongoing administration: Partial FTE for governance and support.
Benefits: Retention lift, CE revenue, hours saved × loaded rate
- Retention lift: Additional students who persist multiplied by net tuition and fee margin.
- Continuing education revenue: Micro-credentials and certificates sold.
- Productivity savings: Faculty and staff hours saved multiplied by the loaded hourly rate.
- Avoided tool costs: Retired systems and duplicate licenses.
For example:
Selection Checklist for Universities
Use this table during demos and RFPs. Start with the “Must-have” column. If two vendors tie, compare how many manual steps they remove and how fast you can launch.
90-Day Implementation Roadmap
Ninety days is enough to launch, prove learning impact, and make a scale decision. Keep scope tight, fix issues in the flow of work, and collect evidence as you go so nothing depends on end-of-term cleanup.
Days 0–30: Foundation and pilot setup
Start with governance that people can follow. Name a sponsor, a project lead with decision rights, and a small working group that meets twice a week. In parallel, stand up identity and data in a sandbox, map roles, and validate SIS records on real rosters.
Build two master shells per program with a repeatable weekly pattern, outcome tags on assessments, and an accessibility-checked template. Choose three to five pilot sections, copy shells, shift dates, assign roles, and publish week one. Open one support path with SLAs and a clear escalation ladder.
- Focus: SSO in sandbox, SIS read, template quality, accessible design, single support queue
- Key actions: Verify adds and drops on sample sections, lock SIS mappings, publish reusable modules for orientation and integrity, test sign-in on all roles
- Milestones by day 30: SSO live for pilot users, SIS nightly sync verified, master shells approved, week one published, support path tested end to end
Days 31–60: Teaching quality, analytics, and early alerts
Move from “it runs” to “it helps.” Enable dashboards that show program, course, and student views with short metric definitions on each report. Tag assessments to outcomes and save anonymized exemplars across performance bands.
After every quiz, run item analysis, retire vague items, and promote strong distractors so banks improve each week. Turn on simple risk rules, write short humane nudges, and route red cases to advisors with a one-page snapshot.
Set grading standards faculty can meet: rubrics on major tasks, a published turnaround target, batch-grading workflow, and a comment library. Train faculty and TAs in a 90-minute session, then hold open office hours twice a week.
- Focus: Dashboards with clear definitions, outcomes mapping, item analysis cadence, and early alerts that staff trust
- Key actions: Enable risk bands, publish nudge templates, agree on grading turnaround, run accessibility checks before each publish
- Milestones by day 60: Alerts active in pilot, weekly analytics digest running, rubrics in use with turnaround tracked, accessibility scans passed, training completed with attendance logged
Days 61–90: Revenue pilot, reporting pack, and scale decision
Demonstrate business value while pilots run. Launch a two to four-week micro-credential: one clear outcome, three modules, a weekly clinic, auto-graded checks, and a certificate with badge metadata.
Turn on checkout, set a simple price, and invite one employer to place a small cohort so you collect both individual and partner signals. Assemble a scheduled accreditation pack: outcome coverage, completion and withdrawal rates, time to feedback, rubric distributions, integrity flags resolved, and early-alert outcomes.
Build a lightweight ROI tracker that uses net tuition margin, CE revenue, hours saved at the loaded rate, and avoided tool costs. Support with hypercare: tag tickets, review daily, and publish a short fix list with owners and dates. Close with a go or no-go based on stability, teaching metrics, reporting readiness, and real ROI.
- Focus: One micro-credential live, scheduled accreditation pack, ROI tracker with real numbers
- Key actions: Test checkout and receipts, confirm badge metadata, map reports to accreditation asks, document a release calendar with freeze windows and rollback steps
- Milestones by day 90: Sprint completed with completion target met, accreditation pack generated from system data only, ROI updated, scale decision recorded, next cohort scheduled
- At a glance (what “ready to scale” looks like): Stable SSO and SIS, faster time to feedback than baseline, clean outcome coverage, pilot completion on target, faculty pulse shows confidence, accreditation pack exports without spreadsheets, CE sprint earns and teaches.
Why an LMS for Higher Education Drives Growth and Efficiency
A modern LMS pays for itself by improving what leaders already measure. You raise enrollment by launching sections faster, lift retention with early alerts, and increase throughput with consistent course shells.
You lower costs to serve by automating assessments and reducing support tickets. You shorten the time to feedback, grow completion, trim grading hours, and open new program revenue through short certificates and employer pathways.
If you are new to this, start small and deliberate. Pick two core courses, apply the template and analytics routine, turn on simple risk rules, and run one micro-credential sprint.
Track retention, time to feedback, completion, hours saved, and CE revenue. When those numbers move, expand with confidence.
Ready to try the workflow you just read about inside a single platform you can launch quickly? Try FreshLearn for free!
FAQs
1. Does an LMS replace an SIS?
No. The SIS remains the system of record for programs, terms, rosters, grades, and billing. The LMS delivers and measures learning. Connect them so enrollments, drops, and accommodations sync cleanly. Keep grade return on for final scores only, unless policy says otherwise.
Try this:
- Enable SSO first, then SIS sync in read-only, then nightly updates.
- Map roles and groups once, lock the mapping, and audit monthly.
2. How do we measure retention impact?
Use a simple before-and-after model with a clean baseline. Track first-year persistence, course pass rates, and withdrawals for similar programs and student mix. Add a weekly view of early-alert outcomes and time to feedback. Report results by cohort, not only by term.
Try this:
- Compare two recent cohorts, controlling for prior GPA and load.
- Attribute gains only where the LMS changed the workflow.
3. What about accessibility and privacy?
Aim for WCAG 2.1 AA and publish a short faculty checklist. Use captions, transcripts, alt text, keyboard navigation, and template contrast checks. Protect data with role-based access, audit logs, and a clear retention schedule. Document who can export what, and when.
4. How do we drive faculty adoption?
Show how the LMS saves time. Start with two master shells, rubrics on major tasks, and batch grading. Deliver a 90-minute hands-on session, then hold weekly office hours. Recruit two champions per program and share quick wins in a monthly note.
5. Can we run micro-credentials without a full shift to online?
Yes. Start small. Launch a two to four-week sprint that reuses your standards. Include one clear outcome, three modules, a weekly clinic, auto-graded checks, and a certificate with badge metadata. Offer simple checkout, and invite one employer partner.
You might also like
Hosted by